All your temperatures
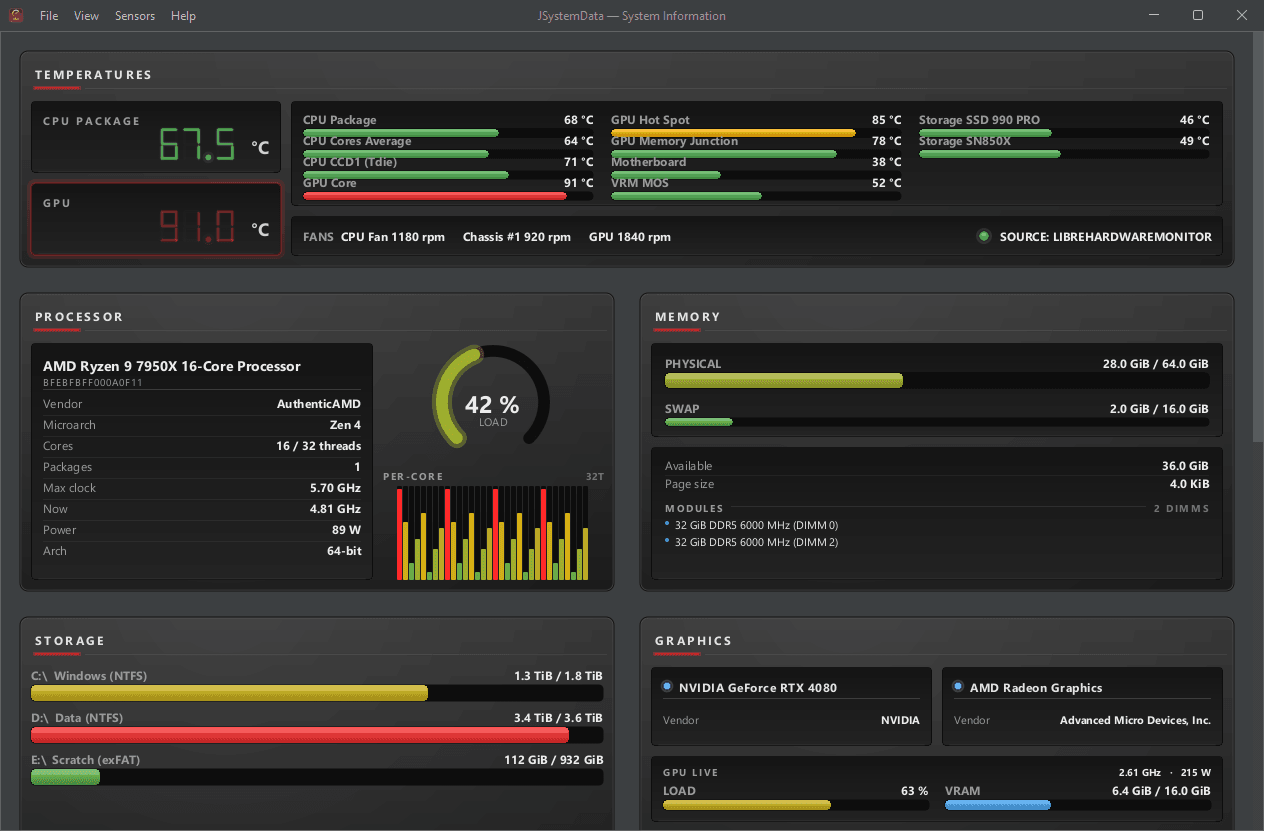
CPU package & per-core, GPU, every SSD/NVMe drive — even USB-attached ones — plus motherboard zones and fan RPM, colour-escalated and flashing on alarm.
 alphabeta.systems
Desktop app for Windows
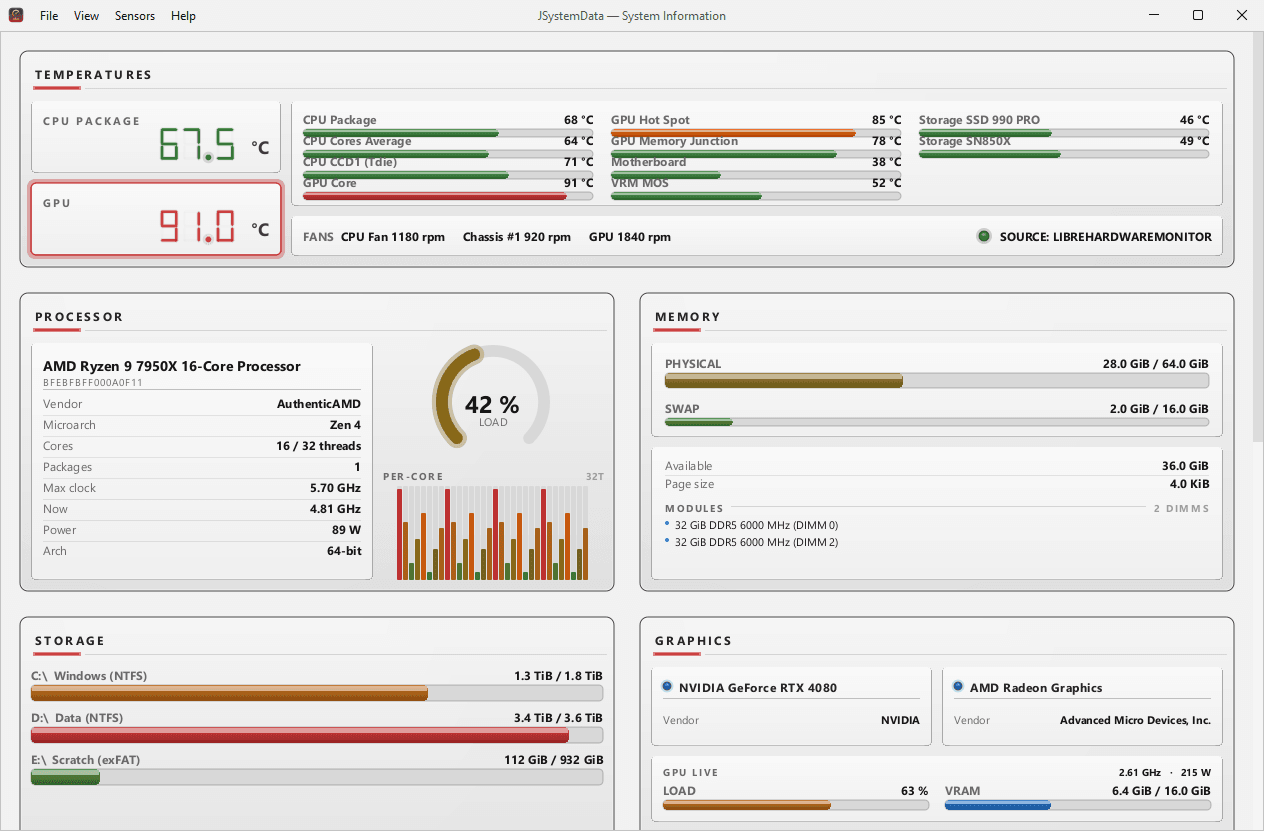
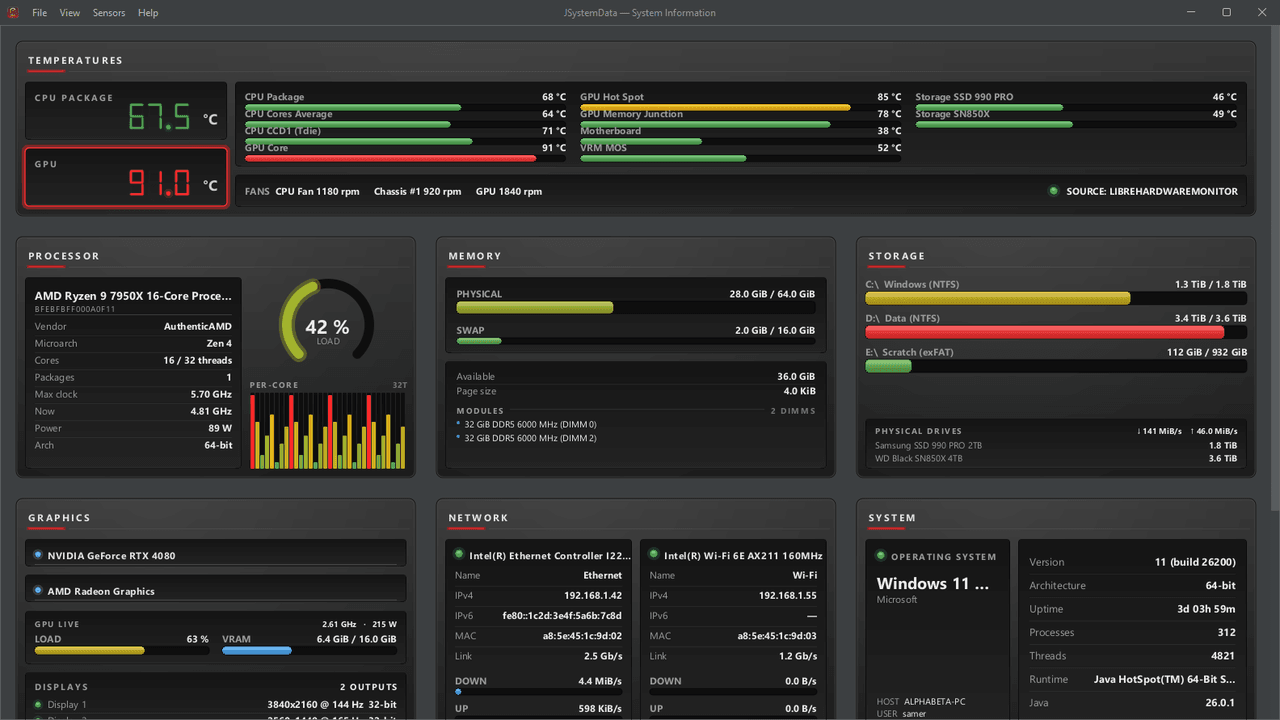
An HMI-styled hardware dashboard — live CPU, GPU & SSD temperatures, load & power, memory, disks, network and a full system inventory, all at a glance.
First run on Windows: if a blue “Windows protected your PC” box appears, click More info → Run anyway. JSystemData is published by alphabeta.systems and is safe — it simply isn’t code-signed yet, so Windows shows a generic warning.
Temperatures need administrator: approve the one-time Windows UAC prompt and JSystemData reads every CPU, GPU, SSD, motherboard and fan sensor. Decline it and the rest of the dashboard still works — only the temperatures panel waits for a sensor source.
JSystemData turns everything your PC knows about itself into one calm, instrument-grade dashboard. Temperatures lead at the top — CPU, GPU and every drive — with the processor, memory, storage, graphics, network and motherboard laid out beneath in clean, colour-coded panels.
It reads the hardware through OSHI and a bundled, elevated sensor bridge, so the readings are real and live: package power in watts, GPU load and VRAM, per-core utilisation, disk read/write throughput and network speed — every value gliding smoothly between samples. It runs on Windows as a single self-contained Java app, with switchable dark and light HMI themes.
Screenshots
Features
CPU package & per-core, GPU, every SSD/NVMe drive — even USB-attached ones — plus motherboard zones and fan RPM, colour-escalated and flashing on alarm.
CPU and GPU package power in watts, GPU load, core clock and VRAM used — the numbers that tell you what the machine is actually doing right now.
A total-load gauge plus a live equalizer of every logical core, so a runaway thread or a parked core is obvious at a glance.
Physical & swap usage, installed DIMMs, per-volume capacity bars, drive models, and live read/write throughput for each disk.
Each active interface with IPv4/IPv6, MAC and link speed, plus a live down/up throughput readout per NIC.
An instrument aesthetic in switchable dark and daylight themes, with every reading easing smoothly between samples — no stutter.
Download
One self-contained .jar with everything bundled. No installer — just a Java 21+ runtime. Launch with java -jar JSystemData.jar (or double-click the jar), and approve the single administrator prompt to unlock the temperature sensors.
FAQ
A free, HMI-styled desktop dashboard for Windows that shows live hardware temperatures (CPU, GPU, every SSD, motherboard and fans), CPU & GPU load and power, memory, storage and disk throughput, network throughput, and a complete inventory of your hardware and OS — all in one self-contained Java app.
Windows only exposes CPU/GPU/SSD temperatures to a kernel-level sensor driver running as administrator. JSystemData bundles a small sensor service and launches it elevated after a single UAC prompt. Decline it and the temperatures panel just shows a no-signal pattern — everything else still works.
No installer. It’s one self-contained jar (~6.4 MB); you only need Java 21+. Run it with java -jar JSystemData.jar.
The jar runs anywhere with Java 21+, and the core inventory works cross-platform. The live temperature/power sensors use a Windows-only bridge, so full temperature support is Windows-only.
Yes — free to download and use.